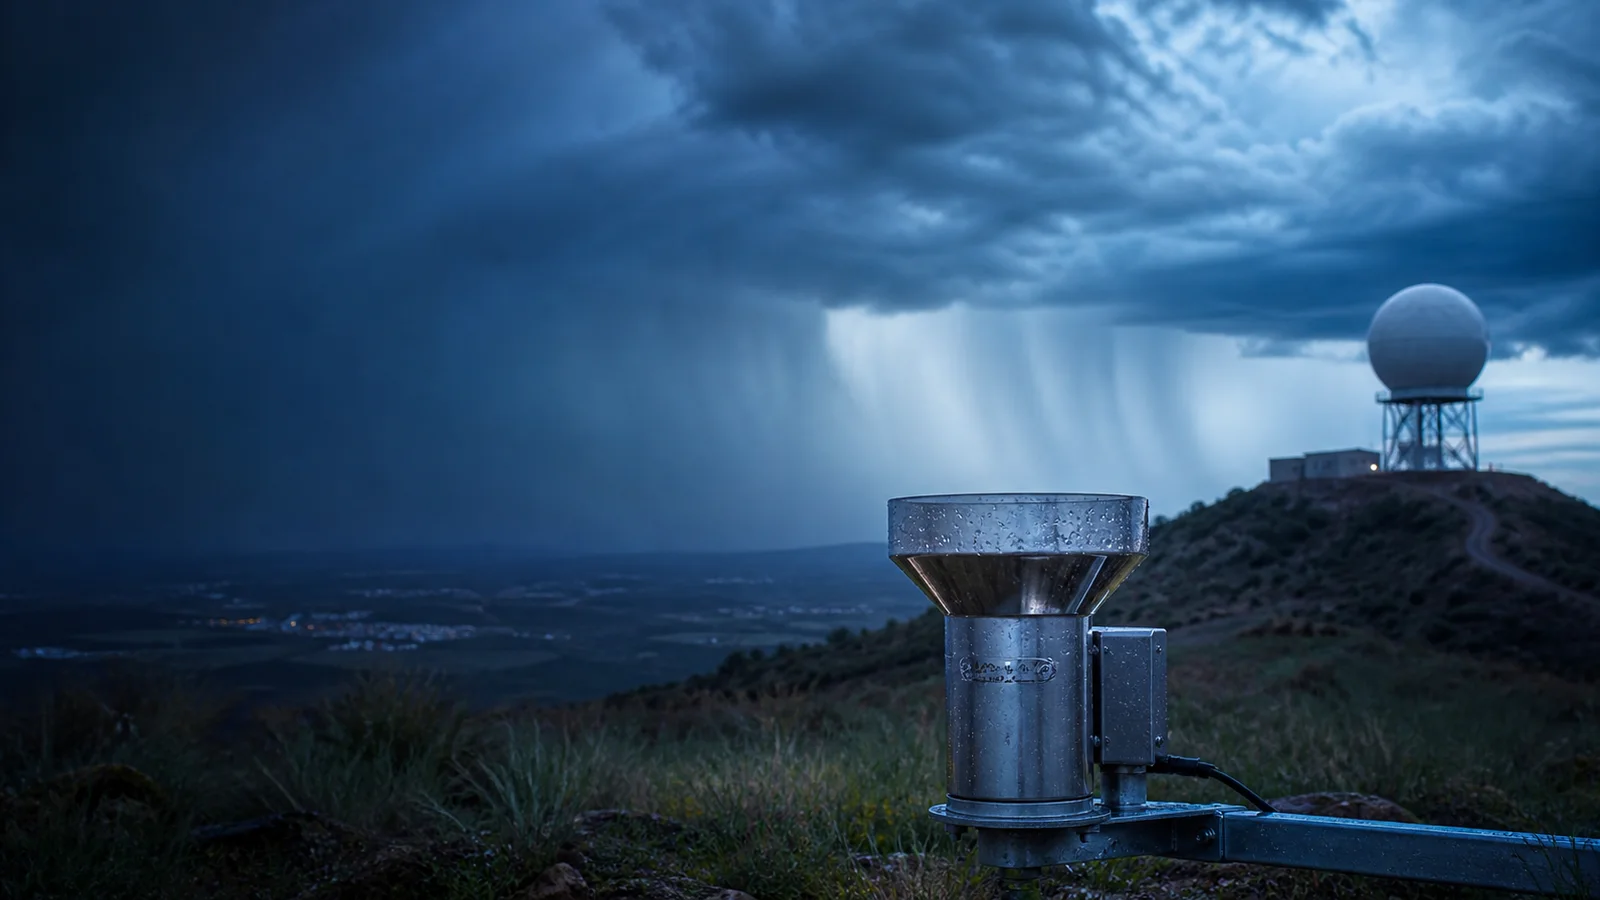
How Rainfall Is Measured and Mapped
Compare a gauge total with radar-estimated rain and satellite precipitation before interpreting accumulation, intensity or flood potential.
Explore rain observations and alertsWhat the data really means
Use these four anchors before interpreting the related live visualization.
- Gauge
- Collected water at one exposed site
- Radar estimate
- Derived precipitation above a ground grid
- Satellite estimate
- Cloud and microwave observations over broad areas
- Accumulation
- Amount integrated across a stated time window
From evidence to the PlanetVexa view
Each stage changes what can be claimed. PlanetVexa keeps the source record, derived interpretation and visual presentation visibly distinct.
- 01Gauge
Collected water at one exposed site
- 02Radar estimate
Derived precipitation above a ground grid
- 03Satellite estimate
Cloud and microwave observations over broad areas
- 04Accumulation
Amount integrated across a stated time window
A rain gauge measures one small opening
Standard gauges collect precipitation for manual measurement, while tipping-bucket and weighing gauges record changes through time. Wind, nearby obstacles, splash, evaporation, blockage and intense rainfall can bias collection. Snow and mixed precipitation require additional handling and a liquid-water-equivalent definition.
A 24-hour gauge total belongs to one site and observation period. It is not an instantaneous rain rate or a direct map of the surrounding county.
Weather radar estimates rain remotely
Doppler radar measures energy returned by hydrometeors aloft. Reflectivity, differential phase and other dual-polarization variables help estimate precipitation type and rate. The algorithm integrates successive estimates to produce accumulation, but beam height, blockage, melting snow, hail and changing drop-size distributions create uncertainty.
Radar does not catch water in a container. Gauge comparisons and quality-control systems help calibrate and correct the spatial estimate.
Satellites extend coverage beyond radar networks
Infrared instruments infer cloud-top properties frequently, while microwave sensors respond more directly to precipitation-sized particles during less frequent overpasses. Merged satellite products combine sensors and sometimes gauges or models to provide broad coverage, especially over oceans and sparsely instrumented land.
A smooth global precipitation field is processed evidence. Resolution, latency and retrieval assumptions determine whether it suits climate monitoring, storm analysis or near-real-time context.
Rain amount and flood impact are not equivalent
The same rainfall can infiltrate, run off or accumulate differently depending on soil moisture, slope, land cover, drainage and storm duration. Flash-flood warnings combine observed or forecast rain with hydrologic and local impact information.
PlanetVexa labels gauge observations, remote estimates, model forecasts and official alerts separately. It does not infer a warning solely from a colored accumulation map.
Questions people ask
Why can radar and a rain gauge disagree?
They sample different volumes and use different methods; wind, beam geometry, precipitation type, timing and local variability all contribute.
Is a radar rainfall map a direct measurement at every pixel?
No. It is an estimate derived from radar observations and algorithms, often adjusted with other evidence.
Does a high rainfall total automatically mean flooding?
No. Duration, antecedent moisture, terrain, drainage, river state and official thresholds affect flood response.
Read the official material
PlanetVexa summarizes these sources in original language and links to the responsible institutions for definitions and operational context.