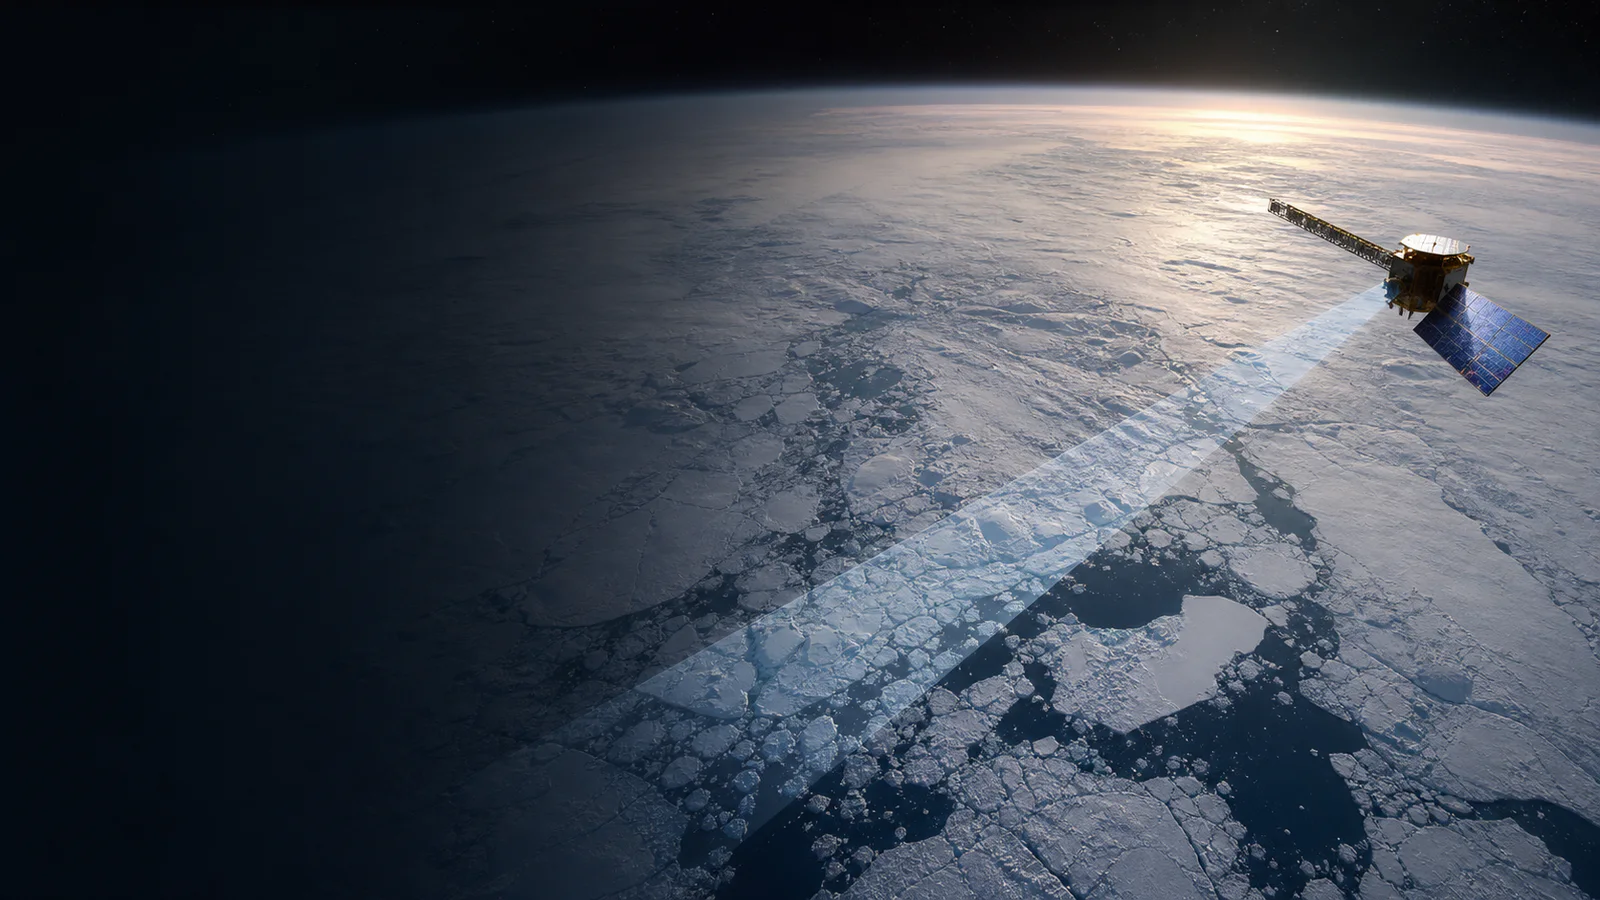
How Satellites Measure Sea Ice
Learn how microwave brightness temperatures become daily sea-ice concentration grids — and why extent, area and thickness answer different questions.
Explore sea-ice observationsWhat the data really means
Use these four anchors before interpreting the related live visualization.
- Passive microwave
- Measures natural microwave emission
- Concentration
- Estimated ice fraction within a grid cell
- Extent
- Area of cells above a stated concentration threshold
- Thickness
- Requires a different measurement and retrieval chain
From evidence to the PlanetVexa view
Each stage changes what can be claimed. PlanetVexa keeps the source record, derived interpretation and visual presentation visibly distinct.
- 01Passive microwave
Measures natural microwave emission
- 02Concentration
Estimated ice fraction within a grid cell
- 03Extent
Area of cells above a stated concentration threshold
- 04Thickness
Requires a different measurement and retrieval chain
Microwaves distinguish ice from open water
The ocean and sea ice emit microwave energy differently because their physical properties differ. Passive microwave radiometers measure brightness temperatures in several frequency and polarization channels. Algorithms use those contrasts to estimate how much of each large sensor footprint is covered by ice.
Unlike visible imagery, passive microwave observations work through most clouds and during polar darkness. Their coarse footprint is the tradeoff: narrow leads, small floes and complicated coastlines may be unresolved or mixed within one grid cell.
Concentration, extent and area are separate metrics
Sea-ice concentration is the estimated percentage of a grid cell covered by ice. Extent commonly sums the area of cells meeting a threshold such as 15 percent, while area weights each cell by its concentration. Two maps can therefore have similar extent but different compactness or open-water fractions.
Threshold, grid, land mask, pole-hole treatment and algorithm version must remain attached to the number. PlanetVexa does not compare unlike products as if they formed one seamless measurement series.
A daily grid is a processed observation
Satellite swaths are calibrated, geolocated and combined onto a polar grid. Weather filters, coastal corrections and quality flags address known artifacts. Near-real-time products prioritize speed; climate data records prioritize consistency and may be revised after additional processing.
Melt ponds and wet snow can resemble open water in microwave signatures, while atmospheric water and land spillover can bias estimates. A clean map boundary is an algorithmic classification, not a surveyed edge.
Thickness and motion require other evidence
Radar or laser altimeters measure freeboard or surface height, which can support thickness estimates when snow depth, density and water level are considered. Synthetic-aperture radar can reveal finer structure, and feature tracking or drifting instruments supports ice-motion products.
PlanetVexa labels concentration, extent, motion and thickness separately with their valid times and sources. Sea-ice products provide environmental context and climate evidence, not local navigation guidance.
Questions people ask
Can a passive microwave map show every crack in the ice?
No. Its broad footprint supports consistent daily coverage but cannot resolve many narrow leads or small floes.
Is sea-ice extent the same as sea-ice area?
No. Extent counts qualifying grid cells; area weights cells by the fraction estimated to contain ice.
Does sea-ice concentration tell us thickness?
No. Concentration describes horizontal coverage. Thickness requires a different observation and retrieval process.
Read the official material
PlanetVexa summarizes these sources in original language and links to the responsible institutions for definitions and operational context.