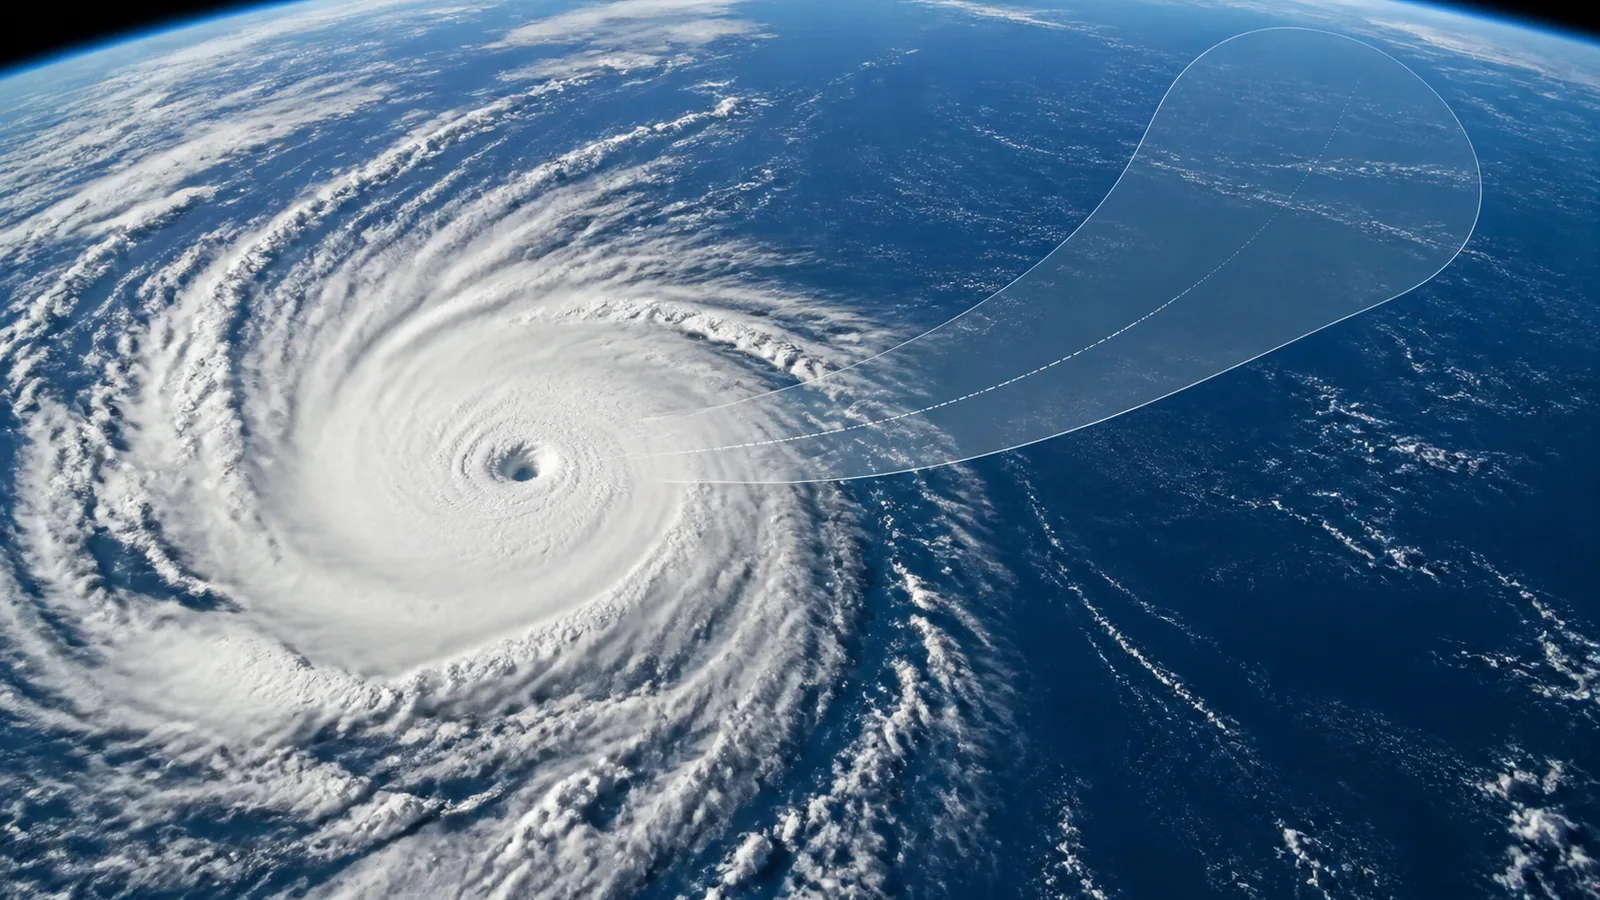
How to Read a Hurricane Forecast Cone
The cone describes uncertainty in the forecast track of a cyclone’s center. It does not show storm size, every hazard or a safe area outside its boundary.
Explore tropical cyclonesWhat the data really means
Use these four anchors before interpreting the related live visualization.
- What it tracks
- Probable path of the cyclone center
- Width
- Historical official track-error statistics
- What it omits
- Full wind, rain, surge and tornado footprint
- Decision rule
- Read advisories, warnings and hazard products together
From evidence to the PlanetVexa view
Each stage changes what can be claimed. PlanetVexa keeps the source record, derived interpretation and visual presentation visibly distinct.
- 01What it tracks
Probable path of the cyclone center
- 02Width
Historical official track-error statistics
- 03What it omits
Full wind, rain, surge and tornado footprint
- 04Decision rule
Read advisories, warnings and hazard products together
The cone follows the center, not the cloud shield
Official forecast positions estimate where the tropical cyclone center may be at stated future times. The operational NHC cone encloses an area based on historical track errors around those forecast points. It is therefore a calibrated uncertainty graphic for the center track, not a drawing of the storm’s physical diameter.
Clouds, tropical-storm-force winds, heavy rain and surge can extend far beyond the cone. A location outside it is not automatically safe.
Its width comes from past forecast performance
The NHC operational definition uses recent official forecast errors to set uncertainty radii at successive lead times. The cone generally widens with time because track uncertainty grows farther into the forecast. Its construction is periodically updated as forecast performance changes, so widths from different seasons are not directly comparable without checking the method.
The center may travel outside the cone. The graphic conveys probability and historical performance, not a guarantee or a boundary between impact and no impact.
Track, intensity and hazards are separate forecasts
A center line or forecast point can include an intensity category, but track uncertainty does not capture every uncertainty in wind strength, rapid intensification, storm size or rainfall. Watches and warnings identify official areas of concern; wind-probability, arrival-time, rainfall and surge products answer other questions.
PlanetVexa preserves advisory issue time and valid time so an old cone is not presented beside a newer cyclone position without context.
Read changes as a sequence, not as a single jump
Forecast tracks evolve when new observations, reconnaissance, satellite analysis and model guidance become available. A small shift can move the drawn cone substantially without meaning the storm itself suddenly moved sideways. Compare advisory cycles, note the valid time and follow the responsible authority’s instructions.
PlanetVexa does not extend an official track, invent missing forecast points or infer warnings from the cone geometry.
Questions people ask
Does the cone show the size of the hurricane?
No. It describes probable track uncertainty for the center, while hazardous conditions can extend far outside it.
Is a place outside the cone safe?
No. Wind, surge, rain and other hazards are not bounded by the cone.
Why does the cone change between advisories?
New observations and forecast guidance can change the predicted track while the uncertainty method remains statistically defined.
Read the official material
PlanetVexa summarizes these sources in original language and links to the responsible institutions for definitions and operational context.